Your Kidneys Were Never the Problem. The Math Was.
How a Race Coefficient Built on 1990s Assumptions Inflated Black Patients' Kidney Function for Over Two Decades, Delayed Transplants, and What Changed in 2021.


If you are a Black patient in the United States, there is a chance your kidney function was overestimated for years.
A math equation made them look that way. And nobody told you it was happening.
For more than two decades, clinical laboratories across this country reported a number called eGFR, estimated glomerular filtration rate, that told your doctor how well your kidneys were filtering waste from your blood. That number determined whether you were referred to a nephrologist. Whether you qualified for certain medications. Whether your name was placed on a kidney transplant waitlist.
And if you were identified as Black, that number was automatically adjusted upward. Your kidneys looked healthier on paper than they actually were.
I am a Clinical Scientist. I have spent years in hospital laboratories running renal panels, validating analyzers, and reviewing the very equations that calculate these results. I want to walk you through how we got here, what the science actually says, and what changed.
Because this is not just a policy discussion. This is a lab literacy issue. And it affected real people, real outcomes, and real lives.
What Is eGFR and Why Does It Matter?
Let’s start with the physiology.
Your kidneys contain roughly one million tiny filtering units called nephrons. Inside each nephron is a structure called the glomerulus, a cluster of capillaries that filters your blood. The rate at which blood passes through these filters is your glomerular filtration rate, or GFR. A normal GFR is around 90 mL/min or higher.
We rarely measure GFR directly. Direct measurement requires injecting a tracer substance like iohexol or inulin into the blood and tracking how quickly the kidneys clear it. This is time-consuming, expensive, and impractical for routine care.
So we estimate it. That is the “e” in eGFR.
The most common way to estimate GFR is through serum creatinine, a waste product generated by your muscles during normal metabolism. Creatinine is produced at a relatively steady rate, freely filtered by the glomerulus, and excreted in urine. When your kidneys are working well, they clear creatinine efficiently. When kidney function declines, creatinine accumulates in the blood.
The relationship seems straightforward: higher serum creatinine, lower kidney function. But creatinine is not a perfect marker. It is influenced by muscle mass, diet, hydration, age, sex, and medications. That is why we use equations instead of raw creatinine values alone.
And this is where the problem begins.
The Equations: A Timeline
1973: Cockcroft-Gault
The first widely used equation for estimating kidney function was developed by Donald Cockcroft and Henry Gault. Their dataset included 249 men from a Canadian veterans’ hospital. No women. No racial diversity. Just 249 hospitalized men with stable kidney function.
This equation was never designed to represent the general population, but it became the standard for decades.
1999: The MDRD Equation
The Modification of Diet in Renal Disease study produced a new equation using a larger cohort. It incorporated age, sex, serum creatinine, and race (Black vs. non-Black). The study included 1,628 patients. Only 197 were Black.
The researchers observed that Black participants in their cohort had higher average serum creatinine levels than White participants at the same measured GFR. Rather than investigating why, they added a race coefficient: a multiplier of 1.21 that automatically inflated eGFR for anyone identified as Black.
The assumption? Black people, as a population, have greater muscle mass, which produces more creatinine.
The evidence for this assumption came from a handful of studies from the 1970s and 1980s that used methods like visual race classification and body densitometry measurements rooted in deeply flawed and racially biased anthropometric science.
2009: The CKD-EPI Equation
The Chronic Kidney Disease Epidemiology Collaboration equation was developed to improve on the MDRD, particularly for patients with relatively preserved kidney function. It used a larger, more diverse dataset.
It still included a race coefficient. This time: 1.159 for patients identified as Black, inflating eGFR by approximately 16%.
The creators of CKD-EPI included race simply because the MDRD had included it. One set of researchers citing the previous set’s decision without re-examining the foundational logic.
What the Race Coefficient Actually Did
Here is what this looked like in practice.
Take two 55-year-old women with identical serum creatinine levels of 2.8 mg/dL. Using the CKD-EPI equation:
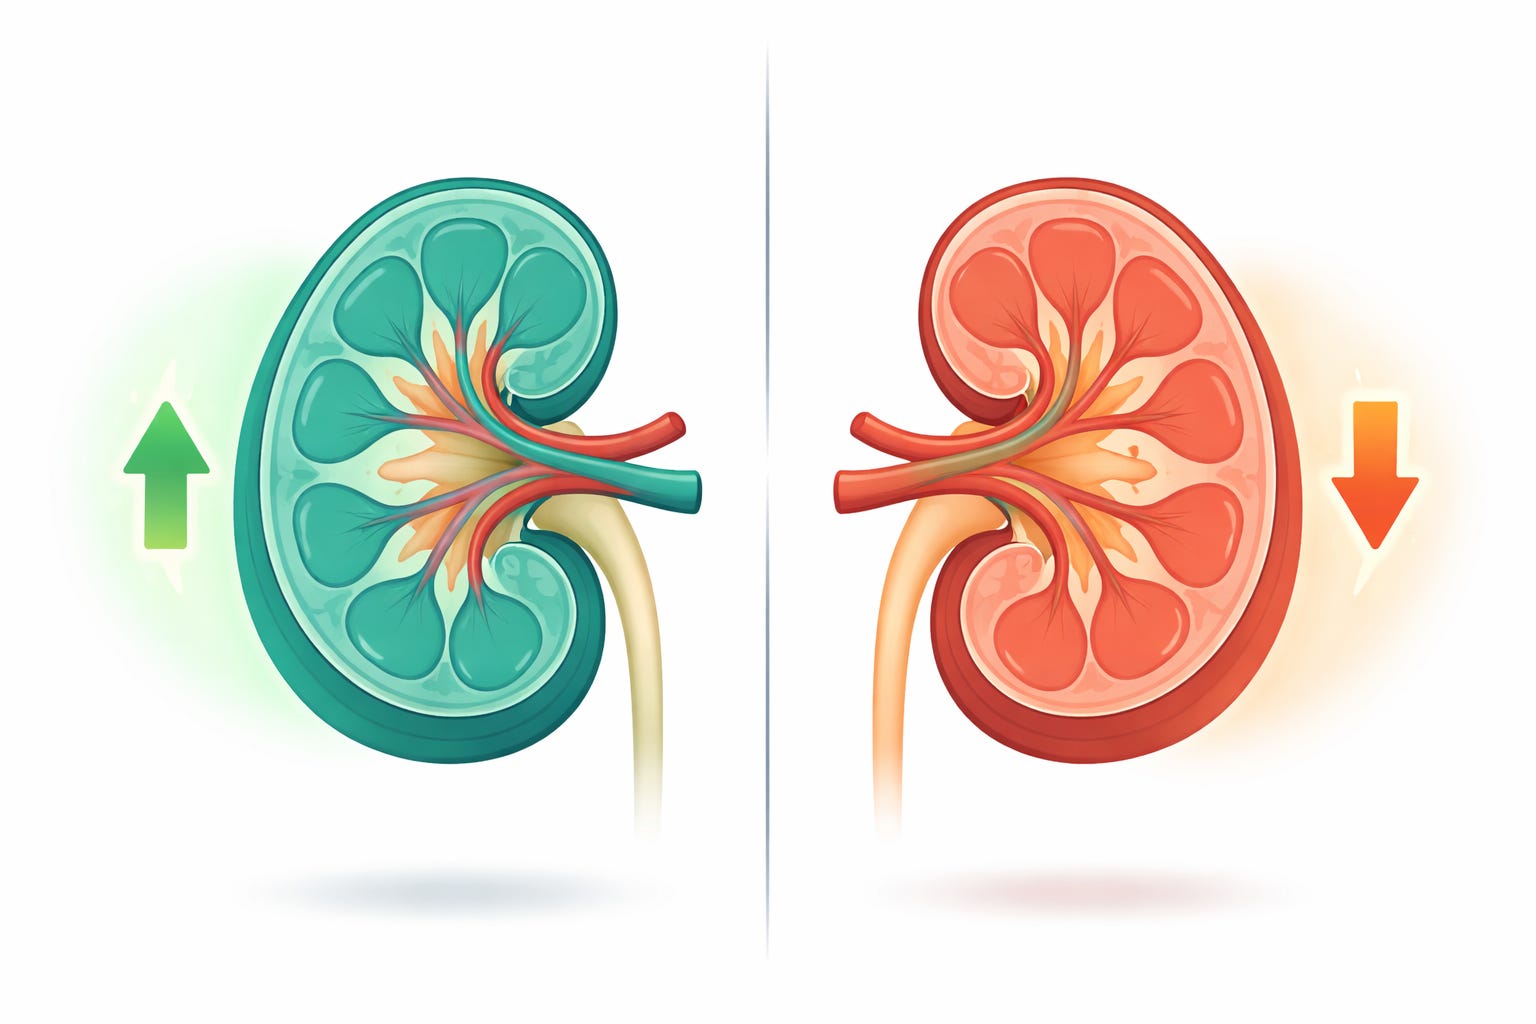
The White woman’s eGFR calculates to approximately 20 mL/min. She qualifies for a transplant referral.
The Black woman’s eGFR calculates to approximately 23 mL/min because the race coefficient inflates her result. She does not qualify.
Same creatinine. Same age. Same sex. Same kidneys. Different number on the lab report. Different clinical outcome.
This was not a rare edge case. This was every single eGFR calculation run on a Black patient in nearly every clinical laboratory in the United States for over 20 years.
The Real-World Consequences
The race coefficient did not just change numbers on a page. It changed care.
Delayed nephrology referrals. Patients who appeared to have better kidney function on paper were referred to kidney specialists later. By the time they were seen, their disease had progressed further.
Delayed transplant eligibility. Kidney transplant waitlist eligibility in the U.S. begins when eGFR falls to 20 mL/min or below. The race coefficient kept Black patients above that threshold longer, even when their actual kidney function was the same as non-Black patients who had already been listed.

Medication dosing errors. Many drug dosing guidelines are adjusted based on eGFR. An inflated eGFR could mean a Black patient received a standard dose of a medication when their actual kidney function warranted a reduced dose.
Later dialysis planning. Preparation for dialysis is triggered by declining eGFR. An artificially higher number delays that preparation.
And the data bears this out. Black Americans make up roughly 13% of the U.S. population but account for over 35% of all patients receiving dialysis for kidney failure. Despite having the highest burden of end-stage kidney disease, they were consistently made to look healthier by the equation designed to assess them.
The Science That Was Never There
Let’s go back to the original justification: that Black people have higher muscle mass, which produces more creatinine, which inflates serum creatinine levels independent of kidney function.
This claim was based on a small number of studies with serious methodological limitations. The datasets were small. The methods for determining race were often visual. The anthropometric measurements used to generalize about muscle mass across an entire racial group relied on racist pseudoscientific frameworks.
And when researchers tested this assumption in other populations, the results were inconsistent. Studies in Ghana, South Africa, and Brazil found that the race coefficient was unnecessary or even harmful when applied to Black populations outside the United States. The race coefficient derived from American study participants did not transfer to other populations who shared the same racial classification but not the same socioeconomic, dietary, or environmental conditions.
This alone should have been the signal. If the coefficient does not work across populations that share the same “race” but differ in everything else, the variable being captured is not biology. It is something structural. Something environmental. Something social.
Race is a social construct. It does not live in the kidney. It does not produce creatinine. And it does not belong in a math equation that determines whether someone gets a transplant.
[PAYWALL BREAK: The rest of this article is for paid subscribers.]
If you have read this far and you understand why this matters, the section below is the clinical deep dive. The physiology of creatinine and cystatin C, exactly what changed in 2021, how the new equation was built, what the transplant data looks like now, and what to ask your provider if you are a Black patient who had eGFR calculated before the change.
This is the kind of lab literacy that changes outcomes.
